
Low Earth Orbit with Solar Flares — A Ticking Time Bomb
- Dr. C. V. S. Kiran

- Dec 8, 2024
- 13 min read
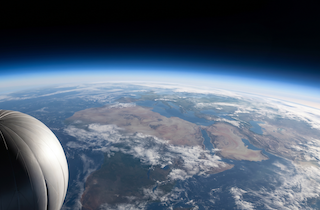
For centuries, humans have been aware of the Sun's power, but only in the last few decades have we realized how devastating solar activity can be to our modern world. The Sun is approaching the peak of Solar Cycle 25, expected in 2025 and scientists are issuing warnings about its potential to disrupt satellite networks, communication systems and even power grids.

We might think that putting together all solar cycles in recorded history (Solar Cycles 1 to 25) along with their average sunspot counts would possibly give us a clear understanding.
Solar Cycle 19 (1954–1964) recorded the highest sunspot activity (~190).
Recent solar cycles (23 and 24) show a decline in sunspot numbers, reflecting lower solar activity compared to earlier peaks.

Plotting it w.r.t. the year might highlight peaks and troughs corresponding to solar cycles and the general 11-year periodicity of solar activity.

The current Solar Cycle 25 is projected to peak around 2025, with a moderate sunspot count compared to historic highs. From the Carrington Event of 1859 to the more recent Halloween Storms of 2003, history has shown that intense solar activity—comprising solar flares, coronal mass ejections (CMEs) and geomagnetic storms—can wreak havoc on Earth's infrastructure. Plotting these major disruptions into the same plot above indicates that the sunspot counts have no direct or indirect influence on these events.

This enhanced graph showcased average sunspot counts (interpolated) over the years since Solar Cycle 1, with Solar Cycle Data (Blue points) along with major solar disruption events. The disruptions are marked with black points and annotated with event descriptions.
Major Solar Disruption Events:
1859: Carrington Event
1921: New York Railroad Storm
1989: Quebec Blackout
2003: Halloween Storms
2012: Near Miss (Carrington-like CME)
This relatively understudied phase of the solar cycle, where giant coronal holes emerge on the sun, could end up being disastrous for Earth-orbiting satellites, which have exponentially multiplied since the last solar cycle. Solar maximum has only just officially begun. The sun's activity would not actually peak until after this explosive phase is over and we enter the solar "battle zone." [REF] As Solar Cycle 25 Reaches Its Peak, Scientists Warn of Impending Solar Disruptions and the Growing Risk to Earth's Orbiting Satellites.
What is different today?
The stakes are higher. The exponential rise in satellite constellations and space debris has created a delicate orbital environment that could spiral into chaos with just one major solar event.
The Science of Solar Activity
The Sun follows an 11-year solar cycle of waxing and waning activity. Each cycle comprises a solar minimum (when sunspots are rare) and a solar maximum (when sunspots and flares peak). Sunspots—dark, cooler areas on the Sun’s surface—are the regions where solar flares and CMEs originate.
Solar Cycle 25, which began in December 2019, is now in its active phase, with sunspot counts steadily rising. Scientists predict the cycle will peak in 2025, but unusual behavior, such as massive coronal holes, has already been observed.
Solar Cycle | Peak Year | Average Sunspot Count |
19 | 1957-1958 | ~190 |
22 | 1989 | ~170 |
23 | 2001-2003 | ~120 |
25 (Projected) | 2025 | ~125 |
Historical Solar Disruptions
Throughout history, significant solar events have disrupted technology and infrastructure:
1859 – The Carrington Event: A colossal X45-class flare triggered the strongest geomagnetic storm ever recorded. Telegraph systems across Europe and North America failed and operators reported electric shocks. If a similar event occurred today, the consequences for our technology-dependent world would be catastrophic.
1921 – New York Railroad Storm:Intense geomagnetic storms disrupted telegraph and electrical systems, particularly in the United States.
1989 – Quebec Blackout:An X15-class flare caused a massive geomagnetic storm, knocking out the power grid in Quebec, Canada and leaving millions in darkness.
2003 – Halloween Storms:X28-class flares damaged satellites, affected GPS systems and forced airlines to reroute flights due to increased radiation at high altitudes.
2012 – A Near Miss:A Carrington-class CME narrowly missed Earth. Scientists estimated that if it had struck, the global economic impact could have reached $2 trillion.
Putting the data across with respect to the Solar Cycles in the recent past:
Solar Cycle 18 (1944-1954): Radio disruptions during World War II
Solar Cycle 19 (1954-1964): New York Railroad Storm (1957–58) caused telegraph failures
Solar Cycle 20 (1964-1976): Satellite damage (Telstar)
Solar Cycle 21 (1976-1986): Quebec Blackout in 1989
Solar Cycle 22 (1986-1996): Anik E2 Satellite Failure in 1994
Solar Cycle 23 (1996-2008): The Halloween Storms 2003
Solar Cycle 24 (2008-2019): Near miss from a Carrington-like CME in 2012
Solar Cycle 25 (2019-2025): Current peak expected in 2025, with risks to satellite operations

This visualization showcases solar cycles, sunspot counts and significant historical disruptions caused by solar activity also highlighting the recurrence of disruptions during solar maximums and the increasing importance of mitigating risks for modern infrastructure like satellites and power grids.
Why Solar Cycle 25 Is Especially Dangerous
The world today is far more reliant on technology than during previous solar cycles. The rapid growth in Low Earth Orbit (LEO) satellites, particularly massive constellations like SpaceX’s Starlink, Amazon’s Project Kuiper and OneWeb, has created an overcrowded and fragile orbital environment.
Vulnerability of Satellites:
Solar flares emit high-energy radiation (X-rays, protons) that can fry satellite electronics and cause data corruption.
Coronal Mass Ejections (CMEs) release charged particles that trigger geomagnetic storms, increasing atmospheric drag and causing satellites to deorbit prematurely.
Collision Risk: Damaged satellites that lose attitude control or fail completely become space debris. A collision between just two satellites could generate thousands of debris fragments, triggering a Kessler Syndrome—a cascading chain reaction of collisions that could render entire orbital regions unusable.
Non-Propulsive Satellites: Many CubeSats and small satellites lack propulsion systems, meaning they cannot maneuver to avoid collisions, making LEO increasingly hazardous.
Effects of Solar Flares on Satellites
High-energy Radiation: Massive solar flares release X-rays, extreme UV radiation and energetic particles, which can:
Damage or disable satellite electronics (single-event upsets, latch-ups).
Cause malfunctions in attitude control systems, affecting satellite stability and orientation.
Corrupt communication systems, leading to loss of ground control.
Increased Atmospheric Drag:
Solar flares and coronal mass ejections (CMEs) heat the upper atmosphere, causing it to expand. This increases atmospheric drag on satellites in LEO.
Satellites could lose altitude unpredictably, causing trajectory deviations and orbital decay.
Damage to Satellite Constellations
If two major satellite constellations are affected (e.g., communication or imaging constellations like Starlink or OneWeb), the following would occur:
Loss of Control: Disabled satellites may lose their ability to:
Maneuver to avoid collisions (automated collision avoidance systems become non-functional)
Deorbit safely or station-keep in their orbital slots
Satellite Drift: Non-operational satellites could drift into other orbits, leading to an increased risk of orbital conjunctions
Creation of Debris: If a collision occurs, the resulting debris could further exacerbate risks by initiating a Kessler Syndrome effect—collisions generating more debris, triggering cascading collisions
Orbital Crowding and Collision Potential
The sheer number of satellites in LEO has exponentially increased in recent years, with constellations deploying thousands of satellites (e.g., Starlink, Amazon's Kuiper, etc.)
Damaged satellites drifting out of control, combined with higher satellite densities, increase the probability of accidental collisions
Space Traffic Management (STM) systems might become overwhelmed trying to track disabled or unpredictable satellites
Key Risks of Collisions in Such a Scenario
Short-term
Immediate collisions between defunct satellites or with operational satellites
Ground control teams unable to respond in time due to communications disruptions caused by solar interference
Long-term
Increased debris generation from collisions, permanently affecting key orbits
Critical space-based infrastructure for Earth communications, imaging and navigation becomes compromised
Higher costs for collision avoidance maneuvers and increased fuel consumption for functioning satellites
Mitigating Measures to Minimize Collisions
Preemptive Maneuvers
Satellites equipped with early warning systems may temporarily reposition to avoid the most dangerous trajectories before damage occurs
Design Resilience
Newer satellites often feature shielding against radiation and robust fail-safe mechanisms
Improved Space Traffic Management
Advanced tracking tools and AI-driven simulations can help forecast satellite positions and predict collision risks in near-real-time.
The potential for collisions is high when two major constellations are damaged due to solar flares, primarily because:
Loss of control leads to unpredictable satellite trajectories
Increased orbital crowding raises the risk of conjunctions
Debris from collisions can trigger cascading failures in a "domino effect"
If two satellites from damaged constellations are at risk of colliding due to solar flare-induced disruptions, the likelihood of such a collision occurring is influenced by several factors.
Key Factors Leading to Satellite Collisions
Loss of Attitude Control
Solar flare damage can disable attitude control systems, causing satellites to tumble or lose orientation
This prevents any corrective maneuvering to avoid a collision
Orbital Drift
High-energy solar activity can cause atmospheric drag (in Low Earth Orbit) or orbital perturbations, resulting in unintended drift from their designated paths
This drift increases the chance of two satellites entering the same orbital plane
Loss of Communication
Damaged communication systems prevent ground teams from issuing collision avoidance commands
Without real-time data and control, two satellites operating on predicted trajectories may intersect
Reduced Tracking Accuracy
Space debris and solar radiation can interfere with tracking sensors or ground-based radar systems, reducing precision in predicting the satellites' positions and collision risk
Collision Scenario
If two satellites are unable to correct their orbits and are on intersecting paths:
Relative Speeds: Satellites in LEO typically travel at speeds of ~7.5 km/s (27,000 km/h). Even a glancing collision would cause catastrophic destruction.
Impact Consequences:
Both satellites would fragment into thousands of pieces of space debris
The debris could spread across multiple orbits, endangering other satellites and potentially initiating a cascading Kessler Syndrome effect
Large constellations like Starlink have satellites spaced only a few kilometers apart. If two satellites drift out of control, the chance of collision becomes non-trivial, whatever the reason might be. In Solar Flare scenario, if two satellites are damaged and cannot correct their paths, the risk of collision depends on:
Their proximity and orbital parameters
The severity of solar-induced perturbations
The lack of communication or automated avoidance systems
The estimated probability of collision between two Starlink satellites, considering their relative velocity, orbital crowding and satellite cross-section, is approximately 7.16 × 10⁻⁷ per encounter. While the probability per encounter is low, the large number of satellites in orbit and repeated interactions increase the cumulative risk, especially in cases of disrupted control during a solar flare event. This is based on the following numbers:
G, Relative velocity = 7.5 X 1000 m/s (typical for satellites in LEO)
F, Satellite cross section area for Starlink satellites = 10 m2
B, Orbital shell thickness = 100 meters
A, Mean distance between satellites = 500000 meters
C, Satellite count in shell = 3000 D, Volume of the orbital shell (assuming thin shell geometry) = 4pi (A2) X B
E, Probability density of satellites within the shell satellite_density = C/D
H, Collision probability for two satellites = E X F X G
The Growing Risk to Low Earth Orbit
In 2024, Low Earth Orbit (LEO) has become crowded. Constellations like SpaceX’s Starlink and OneWeb have launched thousands of satellites to enable global internet coverage.
Current Situation:
8,000+ active satellites orbit Earth, with over 6,000 in LEO.
Starlink alone operates 5,000 satellites and plans to expand to 12,000+.
Risk of Solar Flares:
High-energy radiation can fry satellite electronics.
CMEs cause atmospheric expansion, increasing drag on LEO satellites, causing them to deorbit prematurely.
Collision Cascade: Just one collision can generate 17,500+ debris fragments, triggering a chain reaction (Kessler Syndrome) in space, where debris causes further collisions, potentially rendering entire orbital regions unusable.
Assume 24 hours of control disruption and a single satellite might pass within a risky proximity window once per orbit,
L, Disruption_duration = 24 X 60 X 60 s
Number of encounters in a day based on orbital passes:
I, Orbital period = 90 X 60 s
J, Number of orbits per day = 24 X 60 X 60 / I
K, Risky Passes=Orbits per Day X (Satellite Count - 1)
M, Cumulative Probability = Collision Probability per Pass X Risky Passes
Total time in a day = 86,400 seconds
Each orbit = 5,400 seconds
Number of orbits per satellite in 24 hours = 16
A single satellite encounters every other satellite once per orbit as a worst-case scenario
For 3,000 satellites, excluding itself, there are 2,999 risky passes per orbit
Risky Passes =16 X 2999 = 47,984
Cumulative Probability = 7.16 X 10^-7 X 47,984 ≈ 0.034
The cumulative collision probability for two Starlink satellites over a 24-hour control disruption period due to a solar flare event is approximately 0.034 (3.4%). This indicates a significant risk of collision during the disrupted control window, highlighting the critical importance of mitigating strategies.
What If a Major Solar Flare Hits?
Scientists estimate a 1–2% annual chance of an X10+ solar flare during solar maximum. Over the next 3 years (2023–2025), the cumulative risk of a major flare rises to approximately 6%.
Flare Type | Annual Probability | 3-Year Probability |
Moderate X-Class (X1–X5) | ~20% | ~50% |
Severe X-Class (X5–X10) | ~10% | ~27% |
Extreme X-Class (X10+) | ~2% | ~6% |
Impact of an X-Class Solar Flare:
Satellites: Widespread communication failures.
Power Grids: Potential blackouts similar to 1989’s Quebec incident.
Aviation: Flight rerouting due to radiation exposure at high altitudes.
Using historical data, scientists estimate a 1–2% annual chance of an X10+ solar flare during solar maximum.

Over the next 3 years, this cumulative risk rises to approximately 6%. While seemingly small, such an event could have far-reaching consequences:
Immediate Impact:
Disruption of satellite communications (e.g., GPS, Internet).
Potential power grid failures similar to the Quebec blackout.
Increased radiation levels, forcing airlines to reroute polar flights.
Space Debris Crisis:
A collision between satellites damaged by a flare could generate 17,500+ debris fragments.
When two satellites collide, the number of debris fragments generated depends on:
Collision energy (relative velocity).
Satellite mass.
Breakup models (NASA's ORDEM or ESA’s MASTER).
The empirical formula for debris generation in catastrophic collisions is:

Energy Estimation
The kinetic energy (EEE) of the collision is given by:

For typical satellite collisions, the critical energy is in the range of 10^8 Joules.
Debris Count Estimation
Using the empirical model:
Larger fragments (> 10 cm): ~17,500 pieces
Smaller fragments (1–10 cm): Approximately 10 X this number (around 175,000)
Micrometre fragments (≥1 mm): ~100 X this number (around 1.75 million)
This debris increases the probability of further collisions, creating a cascading Kessler Syndrome.
Initial Collision:
Creates ~17,500 large pieces of debris in LEO
Subsequent Collisions:
Each fragment has a probability of colliding with other satellites or debris
Empirical studies suggest that 5–10% of large debris fragments will eventually collide within a decade, depending on altitude and traffic density
Cascading Effect Over Time:
Each collision produces additional debris, leading to a compounding effect
If 10% of the 17,500 fragments collide, 1,750 new collisions occur. Each generates similar debris counts:
1,750×17,500=30.6 million debris pieces
Exponential Debris Growth: Over multiple decades, debris can grow exponentially in uncontrolled orbital regions, rendering key orbits (e.g., 500–1,200 km) unusable
Simulations show that within 30 days, cumulative collision probabilities could approach 100% in crowded LEO regions.

Constants and assumptions for Kessler effect estimation
Number of large debris pieces created in the initial collision (>10 cm)
Initial Debris Count = 17500
Estimated probability of debris hitting another satellite per day
Collision Probability per fragment = 0.00001
Cross-sectional area of a Starlink satellite in m²
Satellite Cross Section = 10 m²
Relative velocity in m/s
Relative velocity = 7.5 X 1000 m/s
Approximate number of satellites in nearby orbital planes
Satellite Count nearby plane = 100
Assess the cascading effect over 30 days
Timeframe in days = 30
Total debris count affecting nearby satellites = Initial Debris Count = 17500
Number of risky passes (debris fragments moving near nearby Starlink satellites) = Total Debris X Satellite Count nearby plane
Probability of debris hitting a nearby satellite in one day = Collision Probability per fragment X Number of risky passes
Cumulative probability of at least one collision over 30 days (Poisson approximation) = 1 - exp(-Probability of debris hitting a nearby satellite in one day X Timeframe in days)
Debris generated from subsequent collisions (assuming each collision generates the same debris count) = Probability of debris hitting a nearby satellite in one day X Timeframe in days X Total Debris
Cumulative Collision Probability: ~100% Over a 30-day period, the likelihood of at least one collision occurring between the initial debris and nearby satellites in the constellation or neighboring planes becomes almost certain due to the high density of satellites and debris.
Secondary Debris Generated: ~9.2 million pieces If a collision occurs, the debris from subsequent collisions will escalate dramatically. This cascading effect, starting from the initial ~17,500 debris pieces, would result in over 9.2 million new debris fragments being generated over a month.
The initial collision between two Starlink satellites creates a dense debris field.
Debris interacts with nearby satellites in the same orbital shell and neighboring planes.
The cascading Kessler effect results in exponential debris growth, which poses a catastrophic risk to satellite constellations, potentially rendering these orbital regions unusable.
Preparing for the Solar Storm
When a massive solar flare occurs, the number of satellites that can get damaged depends on the intensity of the flare, its duration and the vulnerability of the satellites.
Key Factors Affecting Satellite Damage
Solar Flare Intensity: Classified by X-ray strength (e.g., X-class flares are the most intense)
Satellite Altitude:
Low Earth Orbit (LEO) satellites: Most vulnerable to atmospheric expansion (drag) and charged particles
Geostationary Orbit (GEO) satellites: Exposed to intense radiation due to their position in the Van Allen radiation belts
Satellite Hardening: Newer satellites (e.g., Starlink) are designed to withstand space weather, but older or less shielded satellites are highly susceptible
Duration of Exposure: Longer exposure to charged particles increases damage probability
Improved Space Weather Forecasting:Investments in solar observation missions (e.g., NASA's Parker Solar Probe and ESA's Solar Orbiter) are critical for early warning systems
Satellite Hardening:Satellites need better shielding and fail-safes to survive intense radiation from flares and CMEs
Space Traffic Management (STM):Global cooperation is essential to track satellites, debris and prevent collisions in LEO
Active Debris Removal:Technologies such as drag sails and tethers can safely deorbit defunct satellites before they become space hazards
Expected Effects of a Massive Solar Flare
Solar flares emit:
Electromagnetic Radiation (X-rays, UV):
Immediate interference with communication systems, affecting satellites reliant on radio signals
High-Energy Particles (Protons, Electrons):
Penetrate satellite electronics, causing:
Single Event Upsets (SEUs): Bit flips or data corruption
Latch-ups: Permanent damage to electronic components
Geoeffective CMEs (Coronal Mass Ejections):
Cause geomagnetic storms, leading to:
Atmospheric expansion: Increased drag on LEO satellites
Power surges in satellite systems
Quantitative Estimation of Damage
To estimate the number of satellites damaged, assuming:
Probability of Damage per Satellite based on solar flare intensity
Moderate Flare (M-class): ~1-2% chance of satellite damage
Severe Flare (X-class): ~5-10% chance of satellite damage
Number of Active Satellites
Total satellites in orbit (as of 2024): ~8,000
Starlink constellation: ~5,000 satellites in LEO
Damage Estimation for X-class Flare:
Probability of Damage: ~10% for LEO satellites.
Number of LEO Satellites: ~6,000 (including Starlink and other constellations)
The expected number of satellites damaged is:
Satellites Damaged = Total LEO Satellites X Probability of Damage
Satellites Damaged = 6,000 X 0.10 = 600 satellites
Scenarios Based on Flare Severity
Flare Class | Damage Probability | Satellites Damaged (Estimated) |
M-Class | ~2% | ~120 satellites |
X-Class | ~10% | ~600 satellites |
Extreme CME | ~20% | ~1,200 satellites |
In the event of a massive solar flare (X-class), approximately 600 satellites in Low Earth Orbit could get damaged. If the flare is accompanied by an extreme Coronal Mass Ejection, this number could rise to 1,200 satellites or more, potentially disabling large portions of satellite constellations like Starlink.
A Race Against the Sun
The Sun’s activity is an unstoppable force, but its potential to disrupt Earth’s systems is now higher than ever. As Solar Cycle 25 reaches its peak, the overcrowded state of Low Earth Orbit—teeming with satellites and debris—amplifies the risk of a space catastrophe.

The Carrington Event of 1859 reminds us of the Sun’s immense power. In today’s technology-driven world, even a moderately intense flare could trigger satellite collisions, communication blackouts and cascading space debris. Preparing for this inevitability is not just prudent, it is essential for safeguarding the future of space and life on Earth.


Comments